Streaming Engine to 5k+ Users (0) - Set up

Theory rarely aligns perfectly with production reality. I will write a series of articles that walk you through the exact process of how I hunted down a fatal lock contention bottleneck under a massive concurrency spike.
Test Goal
The primary goal of this load test is to prove that the real-time streaming engine remains stable and responsive under massive traffic. The test specifically evaluates the system's ability to seamlessly handle two core user flows simultaneously:
- Flow 1: Session Creation. Users successfully hitting the REST API to create a monitoring session for their chosen stock tickers.
- Flow 2: Real-Time Streaming. Users establishing a WebSocket connection using that generated session ID to continuously receive live price updates.


Check how I designed the Price Streaming Engine before the load test (Article: Price Streaming Engine).
Metrics
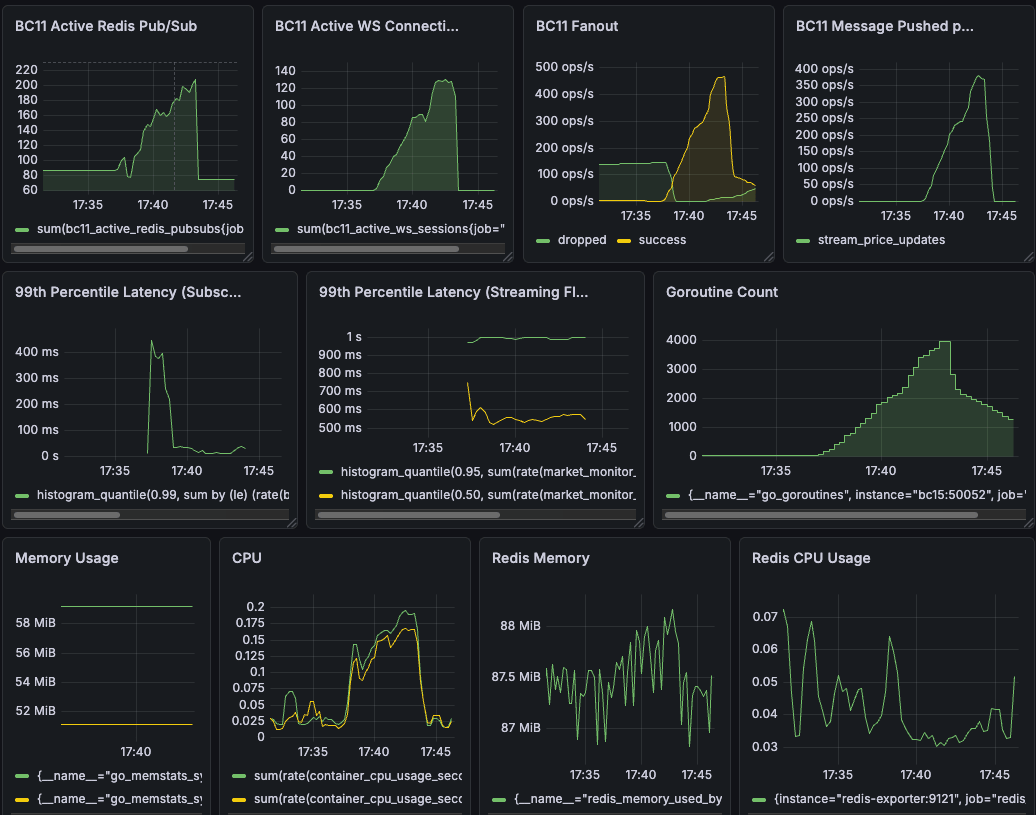
To truly prove the architecture's resilience, I looked at specific Grafana charts to track my custom application metrics and OS-level hardware metrics...
1. Active WebSocket Sessions
bc11_active_ws_sessions
- Definition: A Counter metric tracking the exact number of active monitoring sessions currently registered in the core engine.
- Why do we want this metric: I need to know the exact capacity and load on the server at any given second.
- What this metric can tell us: During the load test, this graph should scale perfectly in sync with the k6 Virtual Users (VUs) connecting. Most importantly, it must drop back to exactly zero when the test finishes. If it stays above zero, it tells me I have "zombie" sessions and a memory leak.
2. Active Redis Pub/Subs
bc11_active_redis_pubsubs
- Definition: A Counter tracking the number of active channels subscribed to the Redis server.
- Why do we want this metric: To monitor the connection overhead on the database layer. Every connection takes up resources, and Redis has strict connection limits.
- What this metric can tell us: This proves my 1-to-1 Ticker-to-Goroutine architecture is working. Even if 5,000 users subscribe to "TSLA", this gauge should only show 1. It tells me the system is successfully multiplexing and preventing database exhaustion.
3. Subscription Update Duration
bc11_subscription_update_duration_seconds
- Definition: A Histogram measuring the time (in seconds) it takes to process a user creating a session or changing their stock subscriptions.
- Why do we want this metric: Because updating subscriptions requires a write lock (sync.RWMutex). I need to measure lock contention in the subscription flow.
- What this metric can tell us: If the P99 latency spikes here, it means thousands of goroutines are waiting in line to read or write state. Keeping this under sub-millisecond levels tells me the lock granularity is optimized and the code is truly thread-safe.
4. Internal Fan-out & Backpressure
bc11_fanout_messages_total
- Definition: A Counter tracking messages broadcasted from Redis into the internal Go channels, labeled by success or dropped.
- Why do we want this metric: To observe the internal streaming engine's health and the effectiveness of the backpressure mechanism.
- What this metric can tell us: A spike in the dropped line during extreme load is a feature, not a bug. It tells me the non-blocking channel design successfully sheds load. The system is intentionally dropping stale ticks for slow clients instead of blocking the main broadcast loop and crashing the server.
"What happens if a client is on a terrible 3G network, their WebSocket buffer fills up, and my Go server cannot push data to them fast enough?"
If I use standard blocking channel operations, a single slow client could block my internal listenToRedis broadcasting goroutine. This would cause a cascading failure, delaying price updates for thousands of users with perfectly good internet connections.
To prevent this, I implemented Backpressure via Non-blocking Channels.
Instead of waiting, I use Go's select statement with a default case. If a user's specific channel buffer is full, I intentionally drop the message:
// Fan-out broadcast to all channels subscribed to this Ticker
for _, sessionChannel := range subscribers {
    select {
    case sessionChannel <- parsedPrice:
        // Success: Buffer has space
        metrics.FanoutMessagesTotal.WithLabelValues("success").Inc()
    default:
        // BACKPRESSURE: Channel is full.
        // Drop the stale price rather than blocking the main broadcast loop.
        metrics.FanoutMessagesTotal.WithLabelValues("dropped").Inc()
    }
}
5. Messages Pushed to Frontend
bc11_messages_pushed_total
- Definition: A Counter tracking the total number of stock price updates successfully pushed out to the end users over the WebSocket.
- Why do we want this metric: To measure the actual business throughput and verify data delivery.
- What this metric can tell us: Watching this number climb steadily confirms the streaming engine is actively doing its job. It proves the server isn't just holding idle connections, but is successfully routing massive amounts of data to the clients.
6. End-to-End Push Latency
market_monitor_e2e_latency_ms
- Definition: A Histogram measuring the total time (in milliseconds) from when a price is generated to when it is successfully pushed to the WebSocket.
- Why do we want this metric: This is the ultimate user experience metric. Having fast internal processing doesn't matter if the final delivery to the trader is slow.
- What this metric can tell us: It proves the entire pipeline—from Redis injection to batching, and finally to the network flush—meets the strict real-time trading requirement. If the P95 stays under 50ms, the architecture is a success.
7. System Errors & Panics
market_monitor_system_errors_total
- Definition: A Counter catching system-level errors and recovered panics, categorized by the component where the error occurred.
- Why do we want this metric: Because silent failures in background goroutines are a nightmare to debug. I need a tripwire for unexpected crashes.
- What this metric can tell us: If this increments during a load test, it exposes a flaw in the error handling or an unexpected edge case (like writing to a closed channel) that needs an immediate fix.
System Health Metrics (CPU, RAM, and Goroutines)
- container_cpu_usage_seconds_total (CPU): * Definition: A metric from the Docker Engine showing how many CPU cores the container is actively burning.
- Why/What it tells us: It verifies that the high concurrency is handled efficiently by Go's scheduler. If latency is high but CPU is low, I know I have a lock contention issue, not a hardware limit.
- go_memstats_heap_inuse_bytes vs go_memstats_sys_bytes (RAM):
- Definition: Tracks the gap between what the Go runtime is actively using (Heap) versus what the OS has reserved for the process.
- Why/What it tells us: It allows me to observe the Garbage Collection (GC) sawtooth pattern. It confirms that my GOMEMLIMIT configuration prevents the process from experiencing an Out-Of-Memory (OOM) kill under peak load.
- go_goroutines:
- Definition: Tracks the total number of goroutines currently existing in the Go runtime.
- Why/What it tells us: A flat plateau during the test means stable concurrency. The count dropping back to the baseline immediately after the test proves zero goroutine leaks.
Setting Up Load Test Scripts
To validate my system, I needed to simulate a highly volatile market opening. I used k6 as my load-generation weapon of choice.
My goal was to saturate both the inbound WebSocket connections and the internal Redis Pub/Sub broadcasting channels simultaneously. I prepared two test scripts to test the system under extreme load and capacity. Both scripts are use the same mock price injection and observability although they have slightly different test parameters that will be explained in the following sections.
- Mock Price Injection: My BC10 service injects 859 prices, randomly generates new prices within a 1% variation rate, and then inserts them into Redis.
- Observability: Prometheus scraping Go runtime metrics, visualized via Grafana.
1. Spike Test Script:
The Test Parameters:
- Target Load: Scaling up to a peak of 1,500 concurrent Virtual Users (VUs) establishing WebSocket connections.
- Traffic Behavior: Each Virtual User (VU) acts like a real, impatient trader. They run in a continuous loop: first, they hit the REST API to create a session for a random batch of 1 to 5 tickers. Next, they open a WebSocket connection, listen to live price updates for a random period (5 to 20 seconds), and then abruptly disconnect. After a quick 1 to 3-second break, they loop back and do it again (capped at 100 iterations per VU). This simulates massive "connection churn" to test if the server cleans up resources properly.
- Traffic Stages:
- Ramp-up: A gradual 3-minute climb to a baseline of 1,000 VUs.
- Baseline Plateau: A sustained 1-minute steady state at 1,000 VUs.
- The Spike: A sudden 30-second surge injecting 500 more users, pushing the total to 1,500 VUs.
- Peak Plateau: Maintaining the extreme 1,500 VU load for 1 minute to test for lock contention.
- Recovery: A rapid 10-second scale-down to 0 VUs to observe how quickly the system releases memory.
// Tickers pool (from mockPriceInit.go)
const TICKER_POOL = [
    ...
];

// Helper function: Randomly select Tickers
function getRandomTickers() {
  const count = Math.floor(Math.random() * 5) + 1; // Randomly select 1-5
  const shuffled = [...TICKER_POOL].sort(() => 0.5 - Math.random());
  return shuffled.slice(0, count);
}

// Helper function: Generate random integer
function randomInt(min, max) {
  return Math.floor(Math.random() * (max - min + 1) + min);
}

// Define stress test script: Extreme load test (Ramp-up -> Spike -> Recovery)
export const options = {
  stages: [
    { duration: '3m', target: 1000 },  // Ramp-up: 3 minutes to ramp up to 5000
    { duration: '1m', target: 1000 },  // Stable at 5000 to observe baseline performance
    { duration: '30s', target: 1500 }, // Spike: 30 seconds to spike to 15000 concurrent
    { duration: '1m', target: 1500 },  // Continue for 1 minute extreme load, test Lock Contention
    { duration: '10s', target: 0 },     // Recovery: 10 seconds to recover from load
  ],
};

// =========================================================
// Function 1: Responsible for calling HTTP API to get Session ID
// =========================================================
function createSession(tickers) {
    const apiUrl = 'http://bc15:8080/v1/sub_stock_price';
    const payload = JSON.stringify({ tickers: tickers });

    const httpParams = {
        headers: {
            'Content-Type': 'application/json',
            'Authorization': TOKEN
        },
    };

    const res = http.post(apiUrl, payload, httpParams);
    check(res, { 'HTTP Session created (200)': (r) => r.status === 200 });

    if (res.status !== 200) {
        console.error(`[VU ${exec.vu.idInTest}] HTTP Failed! Status: ${res.status}, Body: ${res.body}`);
        return null;
    }

    try {
        return res.json('session_id');
    } catch (e) {
        console.error(`[VU ${exec.vu.idInTest}] Failed to parse JSON. Error: ${e}`);
        return null;
    }
}

// =========================================================
// Function 2: Responsible for creating WebSocket and closing it at a random time
// =========================================================
function runWebSocketTest(sessionId) {
    const wsUrl = `ws://bc15:8080/ws?session_id=${sessionId}&token=${TOKEN}`;
    const waitTime = randomInt(5, 20); // Randomly stay 5-20 seconds

    const wsRes = ws.connect(wsUrl, {}, function (socket) {
        socket.on('open', () => {
            // After a random number of seconds, actively disconnect
            socket.setTimeout(function () {
                socket.close();
            }, waitTime * 1000);
        });

        socket.on('message', (msg) => {
            // console.log(`[VU ${exec.vu.idInTest}] Received message`);
        });

        socket.on('error', (e) => {
            if (e.error() != 'websocket: close sent') {
                console.error(`[VU ${exec.vu.idInTest}] WS Error: `, e.error());
            }
        });
    });

    check(wsRes, { 'WS status is 101': (r) => r && r.status === 101 });
}

// =========================================================
// Main Entry Point
// =========================================================
export default function () {
    // Each VU will continue to execute until the test ends
    while (true) {
        const tickers = getRandomTickers();
        const sessionId = createSession(tickers);

        if (sessionId) {
            runWebSocketTest(sessionId);
        }

        // After each reconnection, take a short break
        sleep(randomInt(1, 3));

        // Check if the test time has been exceeded
        if (__ITER >= 100) break; // Prevent infinite loop, actually controlled by options.duration
    }
}
(Note: To prevent my authentication microservice from bottlenecking the load test, I implemented a strict BYPASS_AUTH environment variable coupled with a non-production safety lock. This allowed k6 to instantly establish thousands of connections without dealing with heavy JWT handshakes.)
2. Capacity Test Script:
The Test Parameters:
- Target Load: Scaling up to a massive peak of 5,000 concurrent Virtual Users (VUs) establishing long-lived WebSocket connections.
- Traffic Behavior: Each Virtual User (VU) acts like a dedicated, long-term investor. Instead of aggressive churning, they connect once and stay online. First, they hit the REST API to create a session for a random batch of 1 to 5 tickers. Next, they open a WebSocket connection and continuously listen to live price updates for the entire duration of the test (up to 15 minutes). This simulates a sustained, high-volume data streaming scenario without connection drops, testing the absolute capacity of our broadcasting engine.
- Traffic Stages: * Ramp-up: A gradual 5-minute climb from 0 to 5,000 VUs.
- Baseline Plateau: A sustained 5-minute steady state maintaining the peak 5,000 VU load. This provides a clear, noise-free window to observe system performance under maximum capacity.
- Recovery: A rapid 30-second graceful scale-down to 0 VUs to observe how efficiently the system releases memory.
const TICKER_POOL = [
    ...
];

function getRandomTickers() {
    const count = Math.floor(Math.random() * 5) + 1;
    const shuffled = [...TICKER_POOL].sort(() => 0.5 - Math.random());
    return shuffled.slice(0, count);
}

// =========================================================
// 1. Adjust script: Gradually ramp up to 5,000 users and maintain stability
// =========================================================
export const options = {
  stages: [
    { duration: '5m', target: 5000 },  // Gradual ramp-up to 5,000 users
    { duration: '5m', target: 5000 },  // Maintain 5,000 users stable (quiet period)
    { duration: '30s', target: 0 },    // Test end, graceful shutdown within 30 seconds
  ],
};

function createSession(tickers) {
    const apiUrl = 'http://bc15:8080/v1/sub_stock_price';
    const payload = JSON.stringify({ tickers: tickers });
    const httpParams = { headers: { 'Content-Type': 'application/json', 'Authorization': TOKEN } };

    const res = http.post(apiUrl, payload, httpParams);
    check(res, { 'HTTP Session created (200)': (r) => r.status === 200 });
    if (res.status !== 200) {
        console.error(`[VU ${exec.vu.idInTest}] HTTP Failed! Status: ${res.status}`);
        return null;
    }
    try { return res.json('session_id'); } catch (e) { return null; }
}

function runWebSocketTest(sessionId) {
    const wsUrl = `ws://bc15:8080/ws?session_id=${sessionId}&token=${TOKEN}`;

    // =========================================================
    // 2. Remove random disconnections, keep connections until test end (e.g. 10 minutes)
    // =========================================================
    const waitTime = 900; // 600 seconds (10 minutes)

    const wsRes = ws.connect(wsUrl, {}, function (socket) {
        socket.on('open', () => {
            // Here we no longer randomly disconnect, keep it online
            socket.setTimeout(function () {
                socket.close();
            }, waitTime * 1000);
        });

        socket.on('message', (msg) => {
            // Silent receive
        });

        socket.on('error', (e) => {
            if (e.error() != 'websocket: close sent') {
                console.error(`[VU ${exec.vu.idInTest}] WS Error: `, e.error());
            }
        });
    });

    check(wsRes, { 'WS status is 101': (r) => r && r.status === 101 });
}

// =========================================================
// 3. Entry Point:Remove while(true), each VU only executes once connection
// =========================================================
export default function () {
    const tickers = getRandomTickers();
    const sessionId = createSession(tickers);

    if (sessionId) {
        runWebSocketTest(sessionId);
    }

    // Here we don't need while(true), k6 will automatically manage the lifecycle of VU based on options.duration
}
Ref: Ticker Pool
const TICKER_POOL = [
    "A", "AA", "AAL", "AAP", "AAPL", "ABBV", "ABEV", "ABNB", "ABT", "ACGL", "ACI", "ACM", "ACN", "ADBE", "ADI", "ADM", "ADP", "ADSK", "AEE", "AEG", "AEM", "AEP", "AER", "AES", "AFG", "AFL", "AGCO", "AGL", "AIG", "AIZ", "AJG", "AKAM", "ALB", "ALC", "ALGN", "ALL", "ALLE", "ALLY", "ALNY", "AMAT", "AMC", "AMCR", "AMD", "AME", "AMGN", "AMH", "AMP", "AMT", "AMZN", "AN", "ANET", "ANSS", "AON", "AOS", "APD", "APH", "APO", "APP", "APTV", "AQN", "AR", "ARE", "ARES", "ARGX", "ARMK", "ARW", "ASML", "ASTI", "ASX", "ATEYY", "ATO", "AVB", "AVGO", "AVTR", "AVY", "AWK", "AXP", "AZN", "AZO", "BA", "BABA", "BAC", "BAH", "BAM", "BAP", "BAX", "BBD", "BBVA", "BBWI", "BBY", "BCE", "BCH", "BCS", "BDX", "BEN", "BEP", "BG", "BHP", "BHVN", "BIDU", "BIIB", "BILI", "BILL", "BIO", "BIP", "BJ", "BK", "BKNG", "BKR", "BLDR", "BLK", "BMO", "BMRN", "BMY", "BNS", "BNTX", "BP", "BR", "BRKR", "BRO", "BSAC", "BSBR", "BSX", "BSY", "BTI", "BUD", "BURL", "BWA", "BX", "BXP", "BZ", "C", "CABO", "CACC", "CAE", "CAG", "CAH", "CAR", "CARR", "CASY", "CAT", "CB", "CBOE", "CBRE", "CBSH", "CCEP", "CCI", "CCJ", "CCK", "CCL", "CDNS", "CDW", "CE", "CF", "CFG", "CFR", "CG", "CGNX", "CHD", "CHDN", "CHE", "CHKP", "CHRW", "CHT", "CHTR", "CHWY", "CI", "CIEN", "CINF", "CL", "CLF", "CLVT", "CLX", "CM", "CMA", "CMCSA", "CME", "CMG", "CMI", "CMS", "CNA", "CNC", "CNI", "CNP", "CNQ", "CNXC", "COF", "COIN", "COLD", "CONOCOPHILLIPS", "COO", "COST", "CP", "CPB", "CPNG", "CPRT", "CPT", "CQP", "CRH", "CRL", "CRM", "CRWD", "CSCO", "CSGP", "CSL", "CSX", "CTAS", "CTRA", "CTSH", "CTVA", "CUBE", "CUK", "CVE", "CVS", "CVX", "CZR", "D", "DAL", "DAR", "DASH", "DB", "DBX", "DD", "DDOG", "DE", "DELL", "DEO", "DG", "DGX", "DHI", "DHR", "DIS", "DLB", "DLO", "DLR", "DLTR", "DOCS", "DOCU", "DOV", "DOW", "DOX", "DPZ", "DRI", "DT", "DTE", "DUK", "DVA", "DVN", "DXC", "DXCM", "E", "EA", "EBAY", "EBR", "EC", "ECL", "ED", "EDU", "EFX", "EIX", "EL", "ELAN", "ELP", "ELS", "EMN", "EMR", "ENB", "ENPH", "ENTG", "EOG", "EPAM", "EPD", "EQH", "EQIX", "EQNR", "EQR", "EQT", "ERIC", "ERIE", "ES", "ESLT", "ESS", "ET", "ETN", "ETR", "ETSY", "EVRG", "EW", "EWBC", "EXAS", "EXC", "EXPD", "EXPE", "EXR", "F", "FANG", "FAST", "FCX", "FDS", "FDX", "FE", "FERG", "FFIV", "FHN", "FICO", "FIS", "FITB", "FMC", "FMS", "FMX", "FNF", "FNV", "FOXA", "FRFHF", "FRT", "FSLR", "FTNT", "FTS", "FTV", "FUTU", "G", "GD", "GDDY", "GDS", "GE", "GFI", "GFL", "GFS", "GGB", "GGG", "GIB", "GILD", "GIS", "GL", "GLD", "GLOB", "GLPI", "GLW", "GM", "GMAB", "GME", "GNRC", "GOOGL", "GPC", "GPN", "GRAB", "GRFS", "GRMN", "GS", "GSK", "GTLB", "GWLIF", "GWW", "H", "HAL", "HAS", "HBAN", "HCA", "HD", "HDB", "HEI", "HES", "HIG", "HII", "HLT", "HMC", "HOLX", "HON", "HPE", "HPQ", "HRL", "HSBC", "HSIC", "HST", "HSY", "HTHT", "HTZ", "HUBB", "HUBS", "HUM", "HWM", "IAU", "IBKR", "IBM", "IBN", "ICE", "ICL", "ICLR", "IDXX", "IEP", "IEX", "IFF", "IFNNY", "IHG", "ILMN", "IMO", "INCY", "INFY", "ING", "INTC", "INTU", "INVH", "IP", "IPG", "IQV", "IR", "IRM", "ISRG", "IT", "ITUB", "ITW", "IVZ", "IX", "J", "JAZZ", "JBHT", "JBL", "JCI", "JD", "JHX", "JKHY", "JLL", "JNJ", "JNPR", "JPM", "KB", "KBR", "KDP", "KELLANOVA", "KEP", "KEY", "KEYS", "KHC", "KIM", "KKR", "KLAC", "KMB", "KMI", "KMX", "KNX", "KO", "KOF", "KR", "L", "LAD", "LAMR", "LBRDA", "LBTYA", "LCID", "LDOS", "LEA", "LECO", "LEGN", "LEN", "LH", "LHX", "LI", "LII", "LIN", "LKQ", "LLY", "LMT", "LNC", "LNG", "LNT", "LOGI", "LOW", "LPLA", "LRCX", "LU", "LULU", "LUMN", "LUV", "LVS", "LW", "LYB", "LYG", "LYV", "MA", "MAA", "MANH", "MAR", "MAS", "MASI", "MAT", "MCD", "MCHP", "MCK", "MCO", "MDB", "MDLZ", "MDT", "MELI", "MET", "MFC", "MFG", "MGA", "MGM", "MHK", "MIDD", "MKC", "MKL", "MKTX", "MLM", "MMC", "MMM", "MNST", "MO", "MOH", "MORN", "MOS", "MPC", "MPLX", "MPW", "MPWR", "MRK", "MRNA", "MRVL", "MS", "MSCI", "MSFT", "MSI", "MT", "MTB", "MTCH", "MTD", "MTN", "MU", "MUFG", "NBIX", "NDAQ", "NDSN", "NEE", "NEM", "NET", "NFE", "NFLX", "NGG", "NI", "NICE", "NIO", "NKE", "NLY", "NMR", "NNN", "NOC", "NOK", "NOW", "NRG", "NSC", "NTAP", "NTES", "NTR", "NTRS", "NU", "NUE", "NVCR", "NVDA", "NVO", "NVR", "NVS", "NWG", "NWL", "NWSA", "NXPI", "NXST", "O", "OC", "ODFL", "OGE", "OGN", "OHI", "OKE", "OKTA", "OLN", "OLPX", "OMC", "ON", "ORCL", "ORI", "ORLY", "OTEX", "OTIS", "OVV", "OXY", "PAA", "PAC", "PAG", "PANW", "PATH", "PAYC", "PAYX", "PBA", "PBR", "PCAR", "PCG", "PCTY", "PDD", "PEG", "PEP", "PFE", "PFG", "PFGC", "PG", "PGR", "PH", "PHG", "PHM", "PINS", "PKG", "PKX", "PLD", "PLTR", "PLUG", "PM", "PNC", "PNR", "PNW", "PODD", "POOL", "PPC", "PPG", "PPL", "PRU", "PSA", "PSO", "PSTG", "PSX", "PTC", "PUK", "PWR", "PYPL", "QCOM", "QGEN", "QRVO", "QSR", "RACE", "RBA", "RBLX", "RCI", "RCL", "RDY", "REG", "REGN", "RELX", "REXR", "RF", "RGA", "RGEN", "RGLD", "RHI", "RIO", "RIVN", "RJF", "RKT", "RMD", "RNR", "ROK", "ROKU", "ROL", "ROP", "ROST", "RPM", "RPRX", "RRX", "RS", "RSG", "RTNTF", "RTX", "RY", "RYAAY", "SAN", "SAP", "SBAC", "SBSW", "SCCO", "SCHW", "SCI", "SE", "SEDG", "SEE", "SEIC", "SEMPRA", "SHG", "SHW", "SIRI", "SJM", "SKM", "SLB", "SLF", "SMFG", "SNA", "SNAP", "SNN", "SNOW", "SNPS", "SNX", "SNY", "SO", "SONY", "SPG", "SPGI", "SPOT", "SQM", "SSL", "SSNC", "STE", "STLA", "STLD", "STM", "STT", "STX", "STZ", "SU", "SUI", "SUZ", "SWK", "SWKS", "SYF", "SYK", "SYY", "T", "TAK", "TAP", "TCOM", "TD", "TDG", "TDY", "TEAM", "TECH", "TECK", "TEF", "TEL", "TER", "TEVA", "TFC", "TFII", "TFX", "TGT", "TJX", "TLK", "TM", "TME", "TMO", "TMUS", "TOST", "TPL", "TPR", "TRGP", "TRI", "TRMB", "TROW", "TRP", "TRU", "TRV", "TS", "TSCO", "TSLA", "TSM", "TSN", "TT", "TTC", "TTD", "TTE", "TTEK", "TTWO", "TU", "TW", "TWLO", "TX", "TXN", "TXT", "TYL", "U", "UAL", "UBER", "UBS", "UDR", "UELMO", "UGI", "UHAL", "UHS", "UI", "UL", "ULTA", "UMC", "UNH", "UNM", "UNP", "UPS", "URI", "USB", "USFD", "USO", "UTHR", "VALE", "VEEV", "VFC", "VICI", "VIPS", "VIV", "VLO", "VMC", "VOD", "VRSK", "VRSN", "VRTX", "VST", "VTR", "VTRS", "VZ", "WAB", "WAL", "WAT", "WBA", "WCN", "WDAY", "WDC", "WEC", "WELL", "WES", "WEX", "WFC", "WFG", "WHR", "WIT", "WLK", "WM", "WMB", "WMG", "WMT", "WOLF", "WPC", "WPM", "WPP", "WRB", "WSC", "WSM", "WSO", "WST", "WTRG", "WY", "XEL", "XOM", "XP", "XPEV", "XRAY", "XYL", "YMM", "YUM", "YUMC", "ZBH", "ZBRA", "ZG", "ZION", "ZM", "ZS", "ZTO", "ZTS"
];
Docker-Compose Setup
Ref: Docker-Compose Setup
services:
  # Infrastructure
  nats:
    image: nats:2.10-alpine
    labels:
      - "load-test"
    ports:
      - "4222:4222"
      - "8222:8222"
    command: ["-js"]
    networks:
      - lzstock-network

  redis:
    image: redis:8.0.2
    labels:
      - "load-test"
    ports:
      - "6379:6379"
    networks:
      - lzstock-network
  redis-exporter:
    image: oliver006/redis_exporter:v1.58.0
    container_name: redis-exporter
    labels:
      - "load-test"
    environment:
      - REDIS_ADDR=redis:6379
    depends_on:
      - redis
    networks:
      - lzstock-network

  pg:
    image: postgres:17-alpine
    labels:
      - "load-test"
    environment:
      POSTGRES_USER: postgres
      POSTGRES_PASSWORD: password
      POSTGRES_DB: lzstock
    ports:
      - "5433:5432"
    volumes:
      - pgdata:/var/lib/postgresql/data
      - ${DB_ROOT_PATH}/schema/init-dev-schema.sh:/scripts/init-dev-schema.sh:ro
    networks:
      - lzstock-network

  # Services
  bc10:
    image: registry.gitlab.com/lzstock/lzstock/bc10-data-sync:dev-latest
    labels:
      - "load-test"
    environment:
      ENV: dev
      JETSTREAM_URL: nats:4222
      REDIS_URL: redis:6379
      BC10_DATA_SYNC_SERVICE: :8080
      HEALTH_CHECK_PORT: "50052"
    depends_on:
      - nats
      - redis
    networks:
      - lzstock-network

  bc11:
    image: registry.gitlab.com/lzstock/lzstock/bc11-market-monitor:dev-latest
    labels:
      - "load-test"
    ports:
      - "50053:50052"
    ulimits:
      nproc: 65535
      nofile:
        soft: 65535
        hard: 65535
    sysctls:
      - net.core.somaxconn=65535
    environment:
      ENV: dev
      JETSTREAM_URL: nats:4222
      REDIS_URL: redis:6379
      BC11_MARKET_MONITOR_SERVICE: :8080
      HEALTH_CHECK_PORT: "50052"
      MAX_SESSIONS_PER_USER: 15000
      APP_DEBUG: "true"
    depends_on:
      - nats
      - redis
    networks:
      - lzstock-network

  bc13:
    image: registry.gitlab.com/lzstock/lzstock/bc13-investor:dev-latest
    labels:
      - "load-test"
    environment:
      ENV: dev
      JETSTREAM_URL: nats:4222
      REDIS_URL: redis:6379
      PG_DB_URL: postgresql://lzstock_dev_bc13_investor:lzstock@pg/lzstock?sslmode=disable
      BC13_INVESTOR_SERVICE: :8080
      BC1_INDICATOR_INSIGHTS_SERVICE: bc1:8080
      HEALTH_CHECK_PORT: "50052"
    depends_on:
      - nats
      - redis
      - pg
      - bc1
    networks:
      - lzstock-network

  bc15:
    image: registry.gitlab.com/lzstock/lzstock/bc15-api-gateway:dev-latest
    labels:
      - "load-test"
    ports:
      - "8080:8080"
      - "50052:50052"
    ulimits:
      nproc: 65535
      nofile:
        soft: 65535
        hard: 65535
    sysctls:
      - net.core.somaxconn=65535
    healthcheck:
      disable: true
    environment:
      ENV: dev
      JETSTREAM_URL: nats:4222
      BC15_API_GATEWAY_SERVICE: :8080
      BC1_INDICATOR_INSIGHTS_SERVICE: bc1:8080
      BC3_COMPANY_SELECTOR_SERVICE: bc3:8080
      BC11_MARKET_MONITOR_SERVICE: bc11:8080
      BC13_INVESTOR_SERVICE: bc13:8080
      HEALTH_CHECK_PORT: "50052"
      BYPASS_AUTH: "true"
      APP_DEBUG: "true"
    depends_on:
      - nats
      - bc1
      - bc3
      - bc11
      - bc13
    networks:
      - lzstock-network

  # Dependencies (bc1, bc3)
  bc1:
    image: registry.gitlab.com/lzstock/lzstock/bc1-indicator-insights:dev-latest
    labels:
      - "load-test"
    environment:
      ENV: dev
      JETSTREAM_URL: nats:4222
      REDIS_URL: redis:6379
      PG_DB_URL: postgresql://lzstock_dev_bc1_indicator_insights:lzstock@pg/lzstock?sslmode=disable
      BC1_INDICATOR_INSIGHTS_SERVICE: :8080
      HEALTH_CHECK_PORT: "50052"
    depends_on:
      - nats
      - redis
      - pg
    networks:
      - lzstock-network

  bc3:
    image: registry.gitlab.com/lzstock/lzstock/bc3-company-selector:dev-latest
    labels:
      - "load-test"
    environment:
      ENV: dev
      JETSTREAM_URL: nats:4222
      REDIS_URL: redis:6379
      PG_DB_URL: postgresql://lzstock_dev_bc3_company_selector:lzstock@pg/lzstock?sslmode=disable
      BC3_COMPANY_SELECTOR_SERVICE: :8080
      HEALTH_CHECK_PORT: "50052"
    depends_on:
      - nats
      - redis
    networks:
      - lzstock-network

  # Monitoring
  prometheus:
    image: prom/prometheus:latest
    labels:
      - "load-test"
    ports:
      - "9090:9090"
    volumes:
      - ./prometheus.yml:/etc/prometheus/prometheus.yml
    networks:
      - lzstock-network

  grafana:
    image: grafana/grafana:latest
    labels:
      - "load-test"
    ports:
      - "3000:3000"
    volumes:
      - ./grafana/data:/var/lib/grafana
      - ./grafana/dashboards:/var/lib/grafana/dashboards
      - ./grafana/provisioning:/etc/grafana/provisioning
    depends_on:
      - prometheus
    networks:
      - lzstock-network

  cadvisor:
    image: gcr.io/cadvisor/cadvisor:v0.49.1
    container_name: cadvisor
    privileged: true
    labels:
      - "load-test"
    ports:
      - "8081:8080"
    volumes:
      - /:/rootfs:ro
      - /var/run:/var/run:ro
      - /sys:/sys:ro
      - /var/lib/docker/:/var/lib/docker:ro
      - /dev/disk/:/dev/disk:ro
      - /sys/fs/cgroup:/sys/fs/cgroup:ro
      - /var/run/docker.sock:/var/run/docker.sock:ro
    devices:
      - /dev/kmsg
    restart: unless-stopped
    networks:
      - lzstock-network
  k6:
    image: grafana/k6:latest
    labels:
      - "load-test"
    volumes:
      - ./k6/:/scripts
    ulimits:
      nproc: 65535
      nofile:
        soft: 65535
        hard: 65535
    networks:
      - lzstock-network
    profiles:
      - tools

networks:
  lzstock-network:
    driver: bridge

volumes:
  pgdata: